The dashboard
Watcher's dashboard is a single page served by the same local process as its API. Open it at the address printed by npx watcher start, by default http://127.0.0.1:5050.
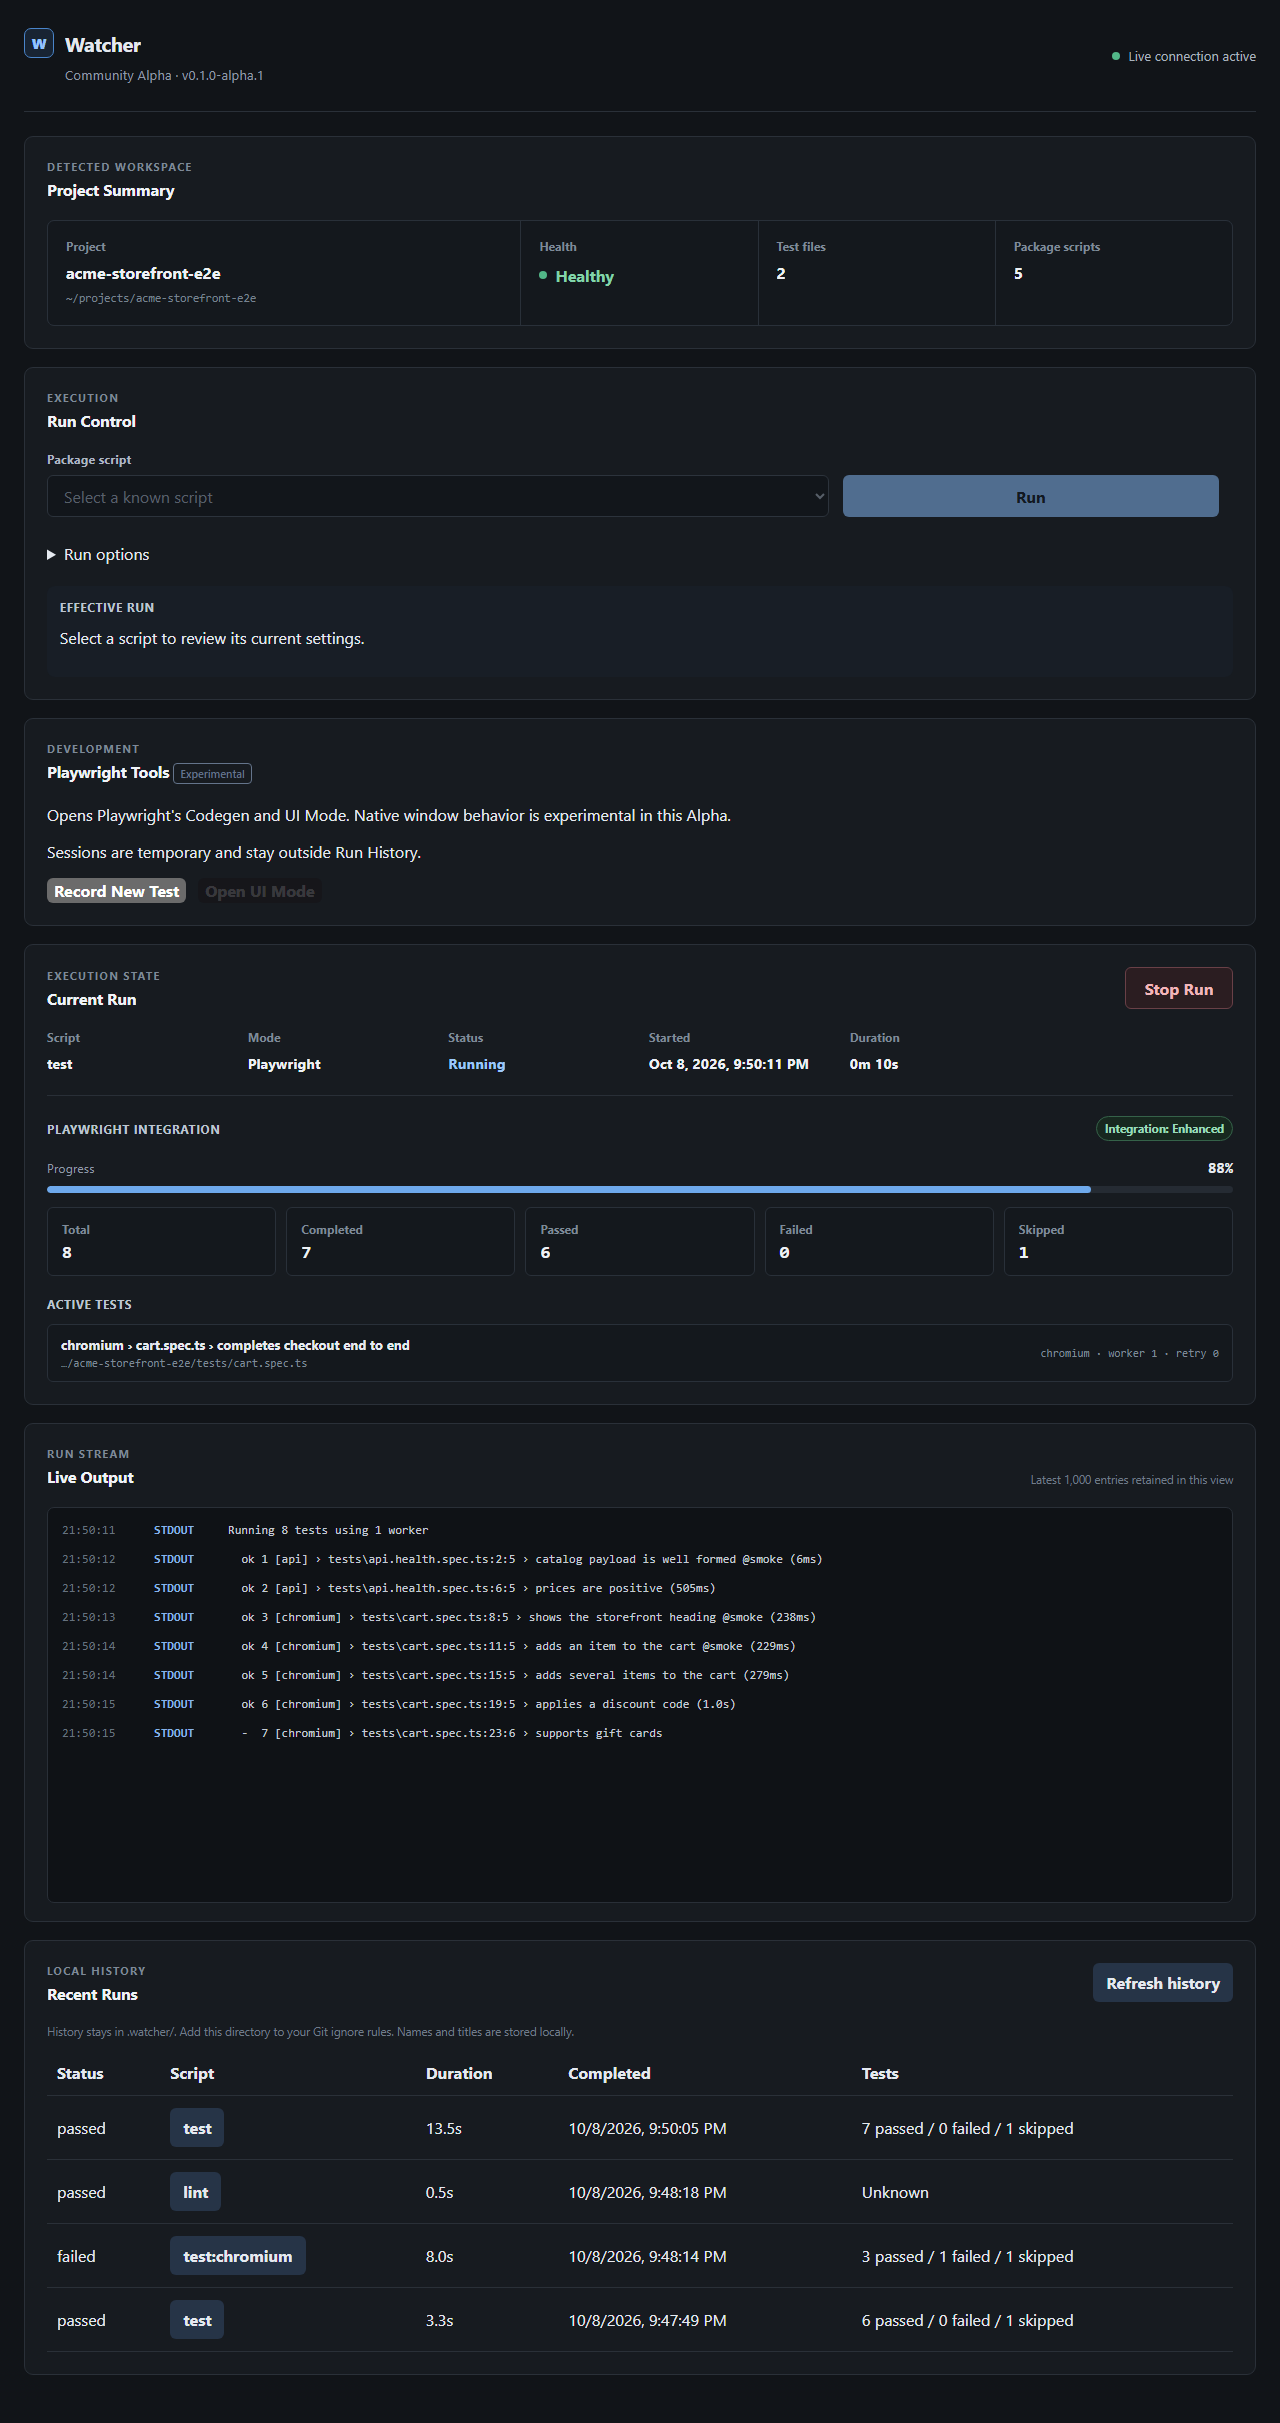
Screenshot of Watcher Community Alpha with a sample project. The local folder path has been shortened.
Panels from top to bottom
| Panel | Purpose | Guide |
|---|---|---|
| Header | Product version and the live connection indicator: connecting, Live connection active, or interrupted. | — |
| Project Summary | Project name and root, health status with reasons, test file count, package script count. | Project discovery |
| Run Control | Choose a package script, adjust Run options, review Effective run and start the run. | Run Planner |
| Playwright Tools (Experimental) | Record New Test (Codegen) and Open UI Mode. | Playwright Tools |
| Current Run | Status, mode, start time, duration and exit code; Playwright integration progress; Stop Run. | Live monitoring |
| Live Output | Timestamped stdout/stderr lines from the run. | Live monitoring |
| Recent Runs | The ten most recent completed runs, with inline Run Detail. | Run history |
Connection state
The dashboard receives live updates over a server-sent event stream. If the connection drops, for example because you restarted Watcher, the indicator shows the interruption and the browser reconnects automatically. After a restart, the dashboard resets its cached run state and reloads the current state from the server.
Theme
The Alpha dashboard uses a single dark theme.
Keyboard and accessibility
The dashboard uses native form controls, buttons and disclosure elements, so you can operate it with the keyboard. Status messages use live regions so screen readers announce run and tool state changes.